30 An early encounter with field data
After returning from Peru in September 1967 {Chapter 13}, I moved from Berkeley to Austin and immediately started grad school (University of Texas). That fall I took a basic ecology course (lectures, labs) taught by H. Gray Merriam, a thoughtful demographer and landscape ecologist. Charles ‘Chuck’ Langley was also a student in that course – he was impressive even then.
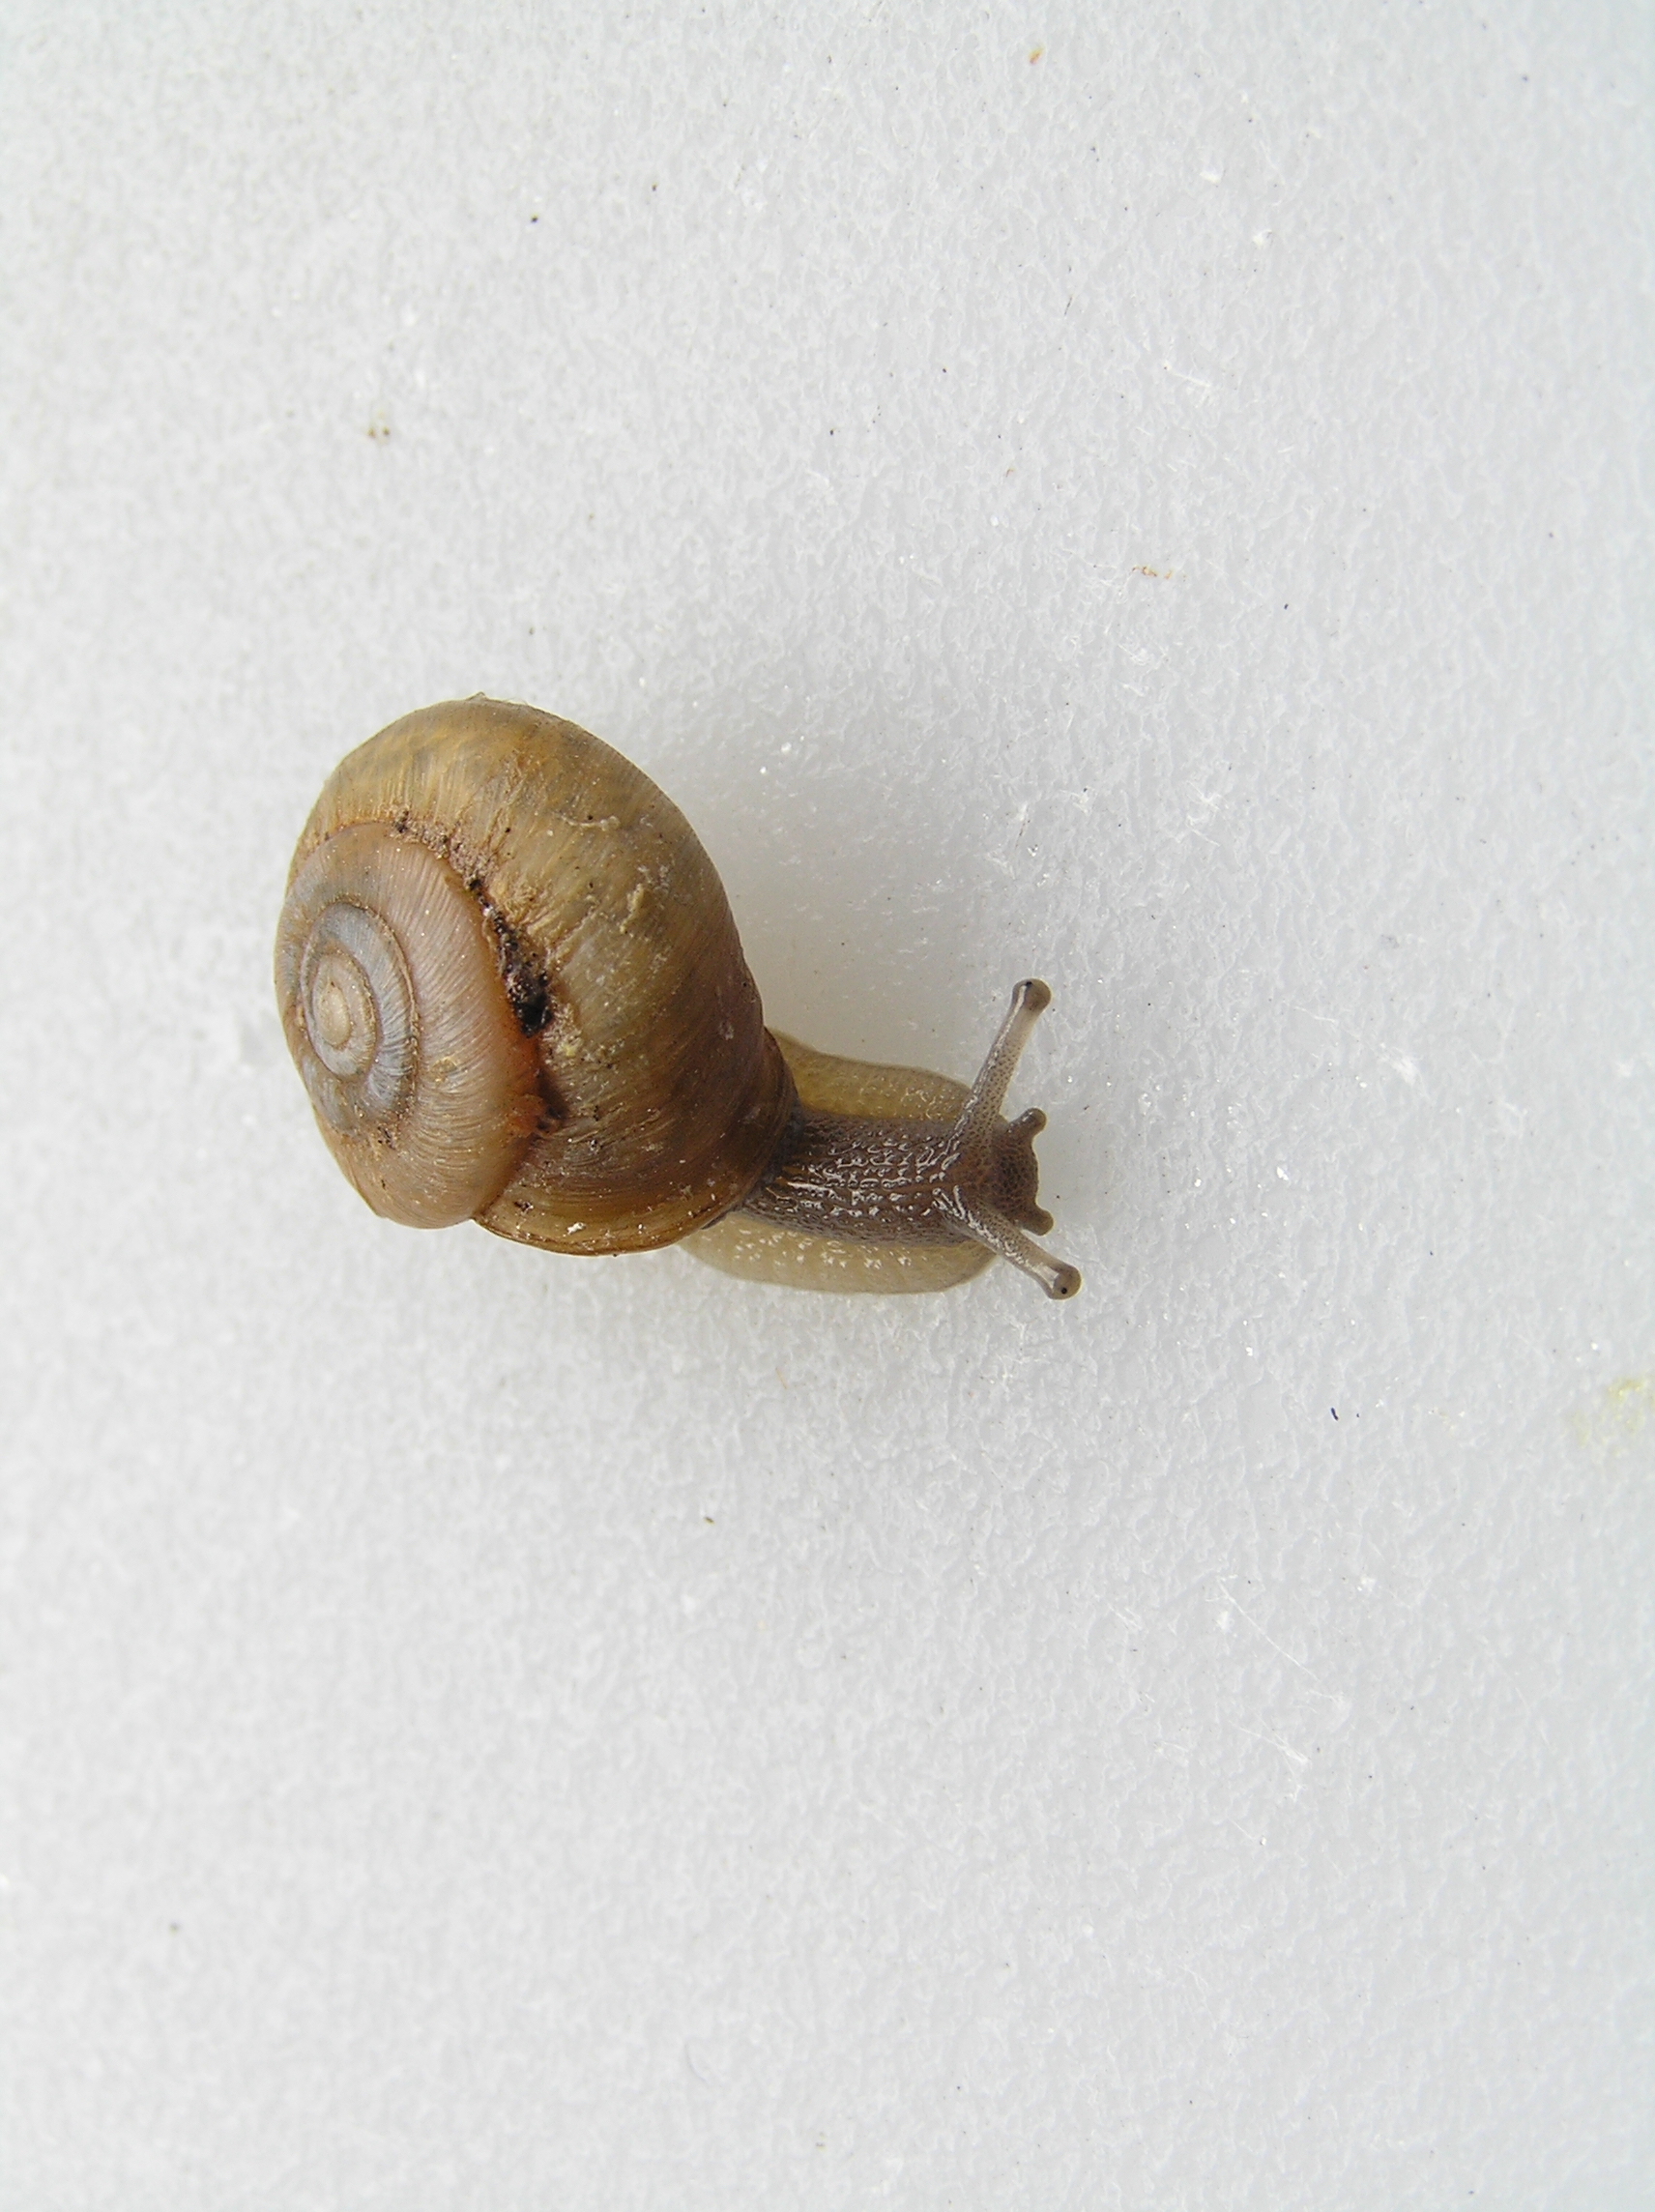
Our first field exercise was at the Brackenridge Field Laboratory, a reserve near Austin. This exercise was conceived and run by Polley McClure, one of Merriam’s grad students. Polley was doing her thesis work on the demography of a local snail, Mesodon. [Note: now called Patera.]
My car needed repairs, so Polley kindly give me a ride to 'Brack Track.' I did not make a good first impression on her as I wore the field clothes that I'd worn all summer in Peru but had not yet had a chance to wash. The September afternoon was hot and muggy, even by Austin standards, and you can guess what Polley thought about me.
Prior to our arrival at Brack Track, Polley and Merriam had laid out a quadrat, perhaps 20 m on a side, and divided it diagonally in half. Our job was to mark all *Mesodon* on the plot (all were in protected retreats under rocks or logs) and record their exact locations. I had no idea that a snail could be so abundant – we marked what seemed like an infinite number.
After we finished, Polley and Merriam watered half of the plot. We came back the next week and recaptured as many snails as we could find and recorded whether they’d moved and if so, how far.
This exercise was geared to get us into the field, to do a manipulative experiment there, and to get experience with real data and analyses. But this was 1967 – long before computers or even hand calculators were available. All calculations had to be done on an electronic adding machine. Data entry was slow, and errors were common and hard to catch. Each of us worked independently (if irritatingly).
Next we analyzed the data and wrote a report on the effect of watering on the movements of *Mesodon*. After only a few moments in the field on our second visit, it was crystal clear to all of us that *Mesodon* in the watered plot moved more often and farther than did snails in the un-watered plot. The obvious conclusion was that the wet plot enabled snails to be active and move about, whereas a dry plots forced snails to stay under cover. Physiologically, this made sense – especially in Austin in September.
But I remember thinking, what a colossal waste of time this will be to quantify the obvious. My concern wasn’t with the experiment but the the mass of data we collected. Working with those data on old-style calculators would be mind numbing. As I note in another context (Chapter 17), my mind works in curious ways when I encounter a chore that will be exceptionally tedious – namely, I try to make it interesting and thus less tedious. But how could I make this analysis interesting, when the results were so obvious and so numerous (and the calculators so primitive)?
My solution was to flip the conclusions. I decided to argue that snails don't like water. Thus snails in the watered sub-plot were moving more because they were attempting to escape flooding inside their retreats. In contrast, snails in the un-watered plot could happily stay where they were, doing whatever slothful snails do under cover. My solution was preposterous, of course, but I found it instantly amusing.
I soon got seriously into data analysis and had a blast, happily punching away at the calculator. I even managed to convince myself that my heretical perspective actually had some merit and wasn’t entirely preposterous after all.
Polley read and graded my report. She quickly figured out that I was playing games with the data, but she gave me an A anyway. She did say something to the effect that it ‘pained her’ to tell me that there's some evidence in the literature that I was right.
There’s a lesson here, of course. Sometimes turning an obvious conclusion on its head can be insightful. Even when it isn't insightful, it may still convert a tedious exercise into entertainment.